Redlining Ogden
by Peter
As with my post on redlining in Salt Lake City, I will almost certainly not do this subject justice. I have not really spent the time to properly engage with this subject, and I will certainly be leaving out important sources and perspectives, as I only have a limited amount of time to spend on this. That said, I still think the maps in isolation have value in thinking about the past and its effect on Ogden and its residents in the present.
Again, as with the map for Salt Lake City, the data for the map included in this post comes from the University of Richmond's Mapping Inequality: Redlining in New Deal America. They've done all the hard work here. I have simply adapted the data to be visible in a Google Map, so that it is easier to compare to existing neighborhoods.
 |
| A locomotive at the railroad depot in Ogden. |
After the election of Franklin D. Roosevelt, during the first 100 days when many significant pieces of the New Deal were passed, Congress created the Home Owners' Loan Corporation (HOLC) to rescue struggling banks and mortgage holders. The HOLC standardized many of the processes around borrowing to buy a home, including the use of appraisals to determine a home's value.
With the assistance of local bankers, real estate agents, and city officials, the HOLC also created maps of any city with over 40,000 residents that outlined which neighborhoods were felt to be suitable for mortgages, and which were poor investments.
The criteria used to grade neighborhoods from A (Best), through B (Still Desirable), C (Definitely Declining), and D (Hazardous) included the age and upkeep of the housing stock, neighborhood amenities such as parks, the prospect of rent, and the nearness or encroachment of commercial and industrial facilities, particularly if the area was in what officials called "the Smoke Zone." Interestingly, the presence of cemeteries is also considered detrimental.
More difficult for us to understand now, was the downgrading of neighborhoods based on the concentration of minorities, particularly black residents and immigrants. In addition to these racial or ethnic categories, the neighborhoods were also classified based on the socioeconomic class of their residents: the more factory workers and laborers a neighborhood had, the less desirable it was, whether the homes were well-maintained or not. In Ogden, there is a lot of emphasis in middle-grade neighborhoods on the presence of "thrifty Dutch" residents that apparently pull those neighborhoods up out of the D and C categories.
Based on these maps created by HOLC, banks limited the areas of a city where they would provide mortgages, or sometimes increased the costs of those mortgages to exorbitant levels. Because these neighborhoods tended to have disproportionate numbers of minority residents, this had the effect of limiting the ability of African Americans and others to buy homes, reducing their ability to accrue wealth through appreciation of the major asset in most Americans' lives.
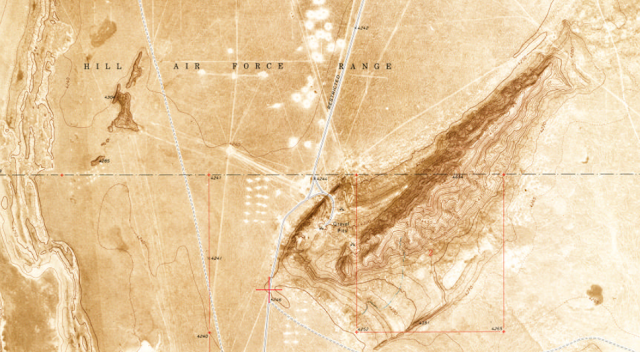
Salt Lake City and Ogden both had HOLC maps created, the only cities in Utah large enough for the effort. Below you can find a map of Ogden showing the neighborhood grades give by HOLC. There is an interesting pattern in Ogden, with a more desirable residential core east of downtown, while less desirable neighborhoods cluster around the railroad and the Weber River. African Americans are mentioned in areas D-1 and D-7. Italian, Basque, and Hispanic residents are also mentioned in these D-level neighborhoods.
I've spent some time working in Ogden and I think that what residents there would classify as desirable or declining neighborhoods has shifted substantially as the city has grown and expanded. Maps of Ogden by income level (at the Census Block Group level) show higher income residents are concentrated on the east benches, while the areas around downtown (including most of those on the HOLC map) have lower incomes on average.
Comments
Post a Comment